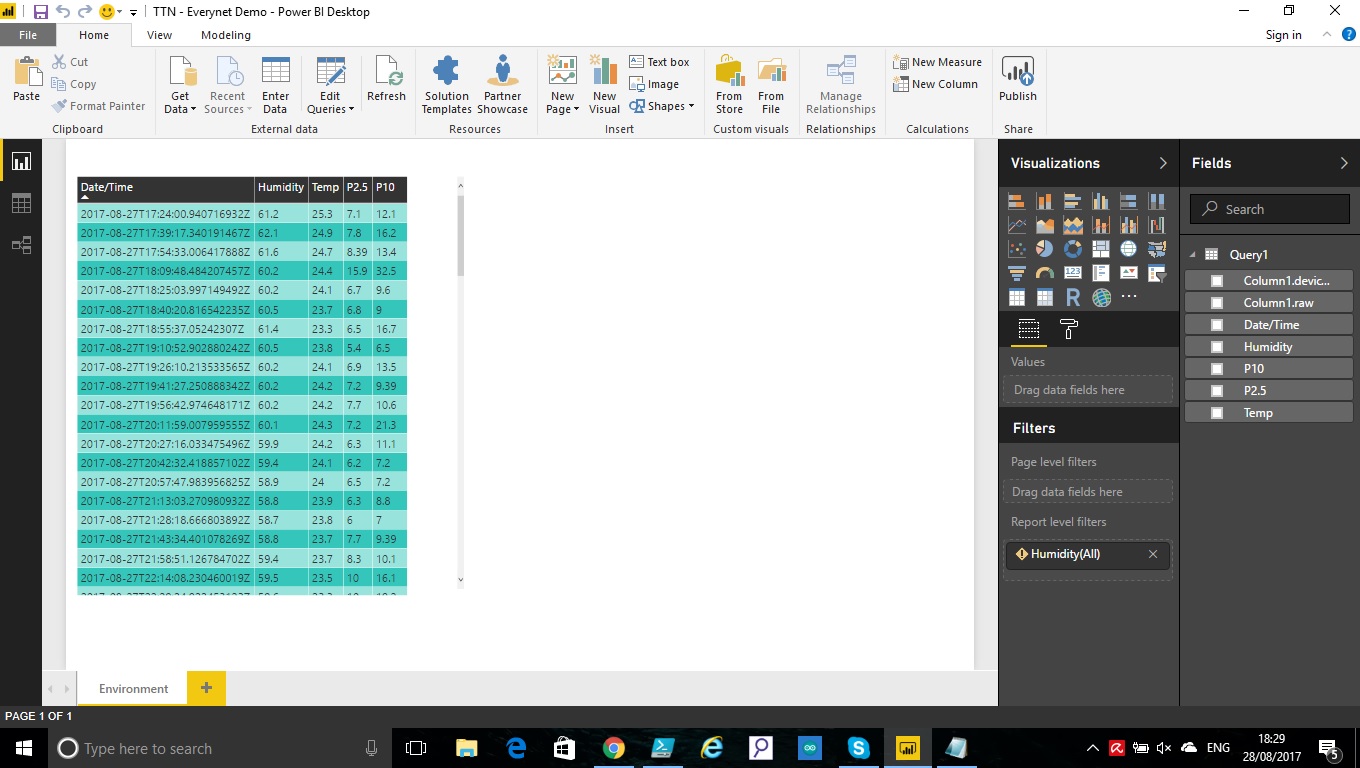
I had to take a look at Microsoft Power BI for a project at work and figured this could also be useful with TTN. This provides a very quick overview of the steps to get you started. I've accessed the data stored in the Data Storage integration provided by TTN and thought I'd share in case anyone else is looking to create a dashboard to visualise their data.
If you haven't done it already enable the Data Storage Integration within your application.
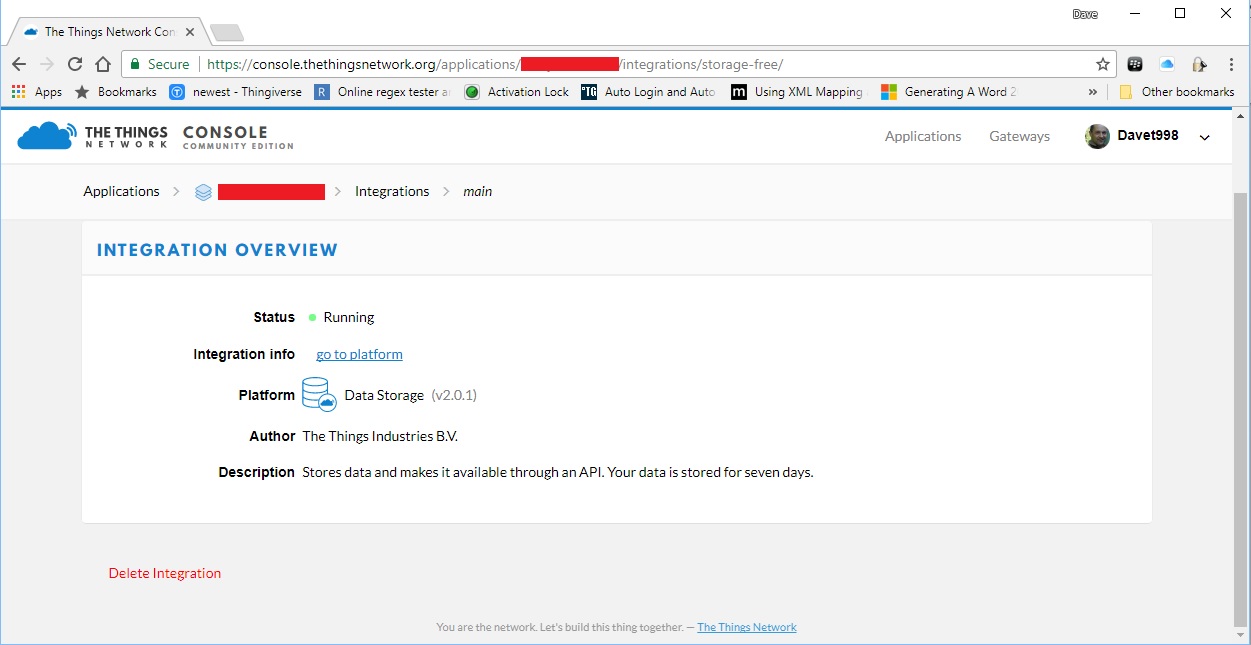
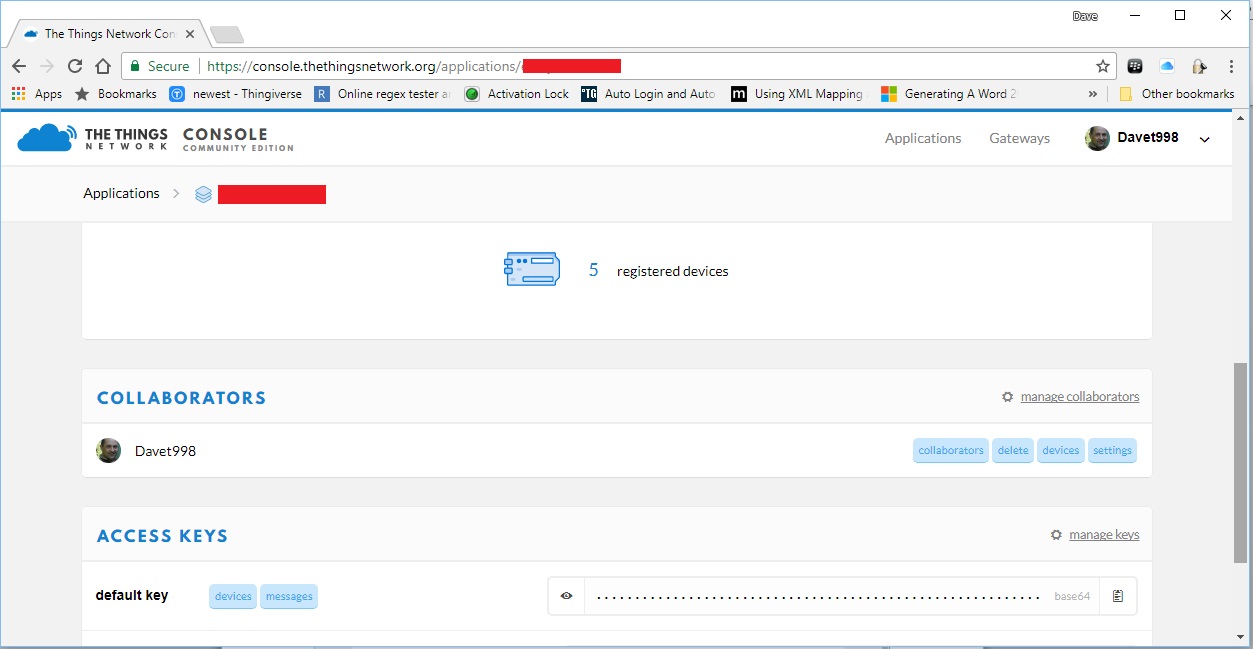
The first step having enabled the Data Storage Integration is to get your application name and Access Key from the TTN Console.
Microsoft BI is a cloud based free tool, you can download the Power BI Desktop from the following link
https://powerbi.microsoft.com/en-us/.
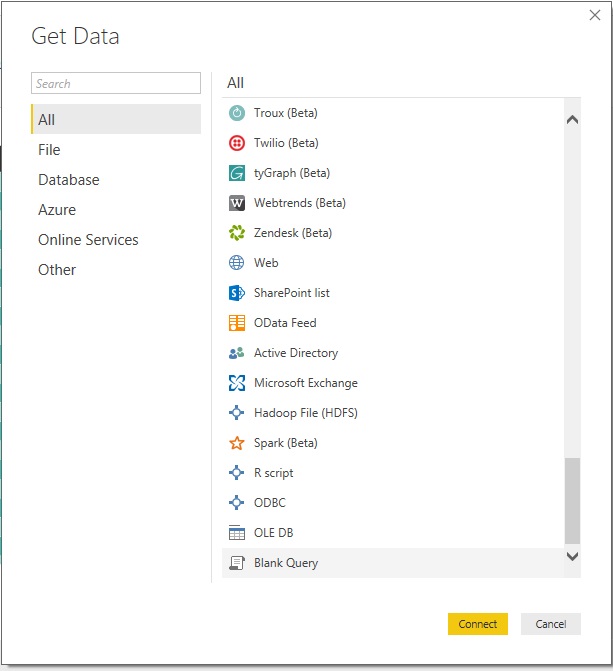
Once installed the next step is to create a query to retrieve the data.
Click on the Get Data button then select Blank Query and click Connect.
You need to replace the three items highlighted in red below with the information about your application the device and the Application Access Key.
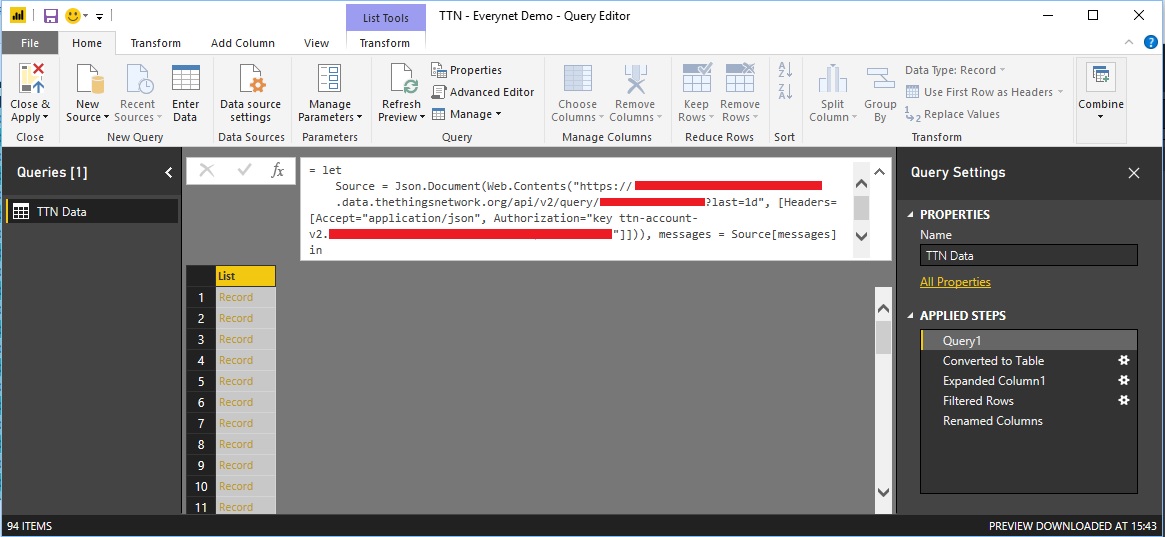
Copy and paste the following code.
You can then filter and format the data to create the dashboard that meets your requirements.
I'm off to add more to my dashboard...
Regards
Dave Thornton
@davet998